Quantitative Data
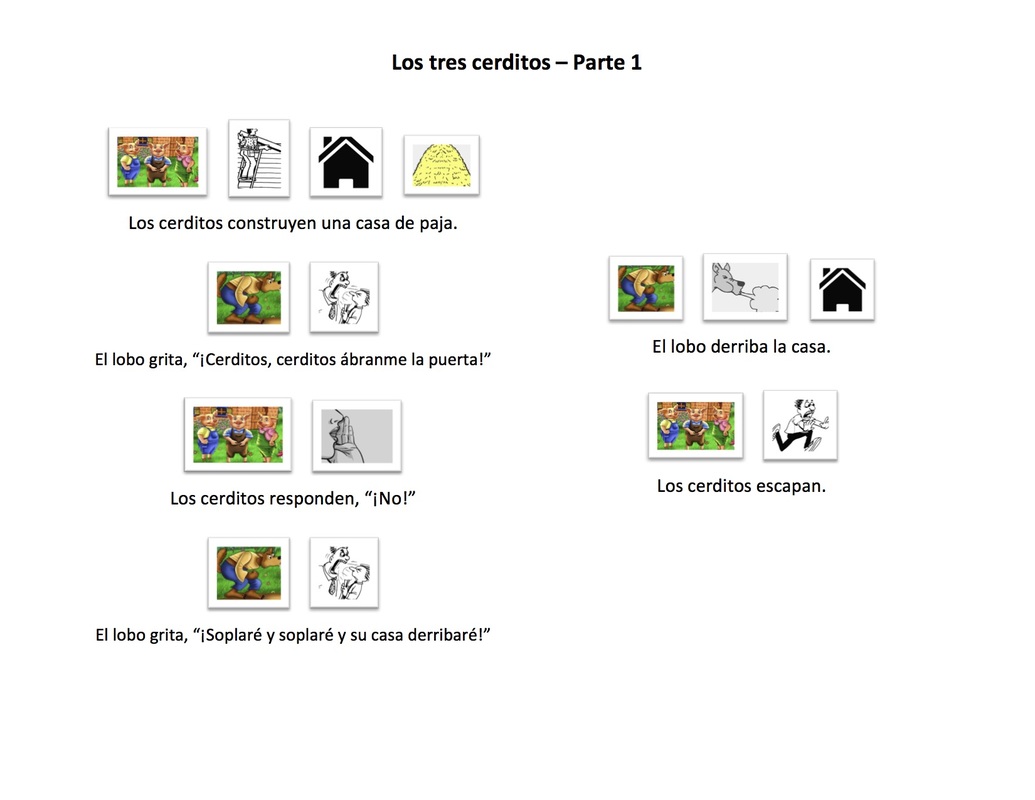
To demonstrate the dramatic academic growth students experienced in my elementary school Spanish class, I have included a teacher-made assessment that tracks students’ ability to read and interpret a text in Spanish. In part one of this assessment students used an annotated text to read and interpret the fable, “The Three Little Pigs” in Spanish. I provided the students a sheet of paper with the words of the story and images above some words to assist with decoding and instructed to read the story with emotion. More specifically, I required students to use storytelling techniques practiced throughout the year to engage the listener and deepen comprehension.
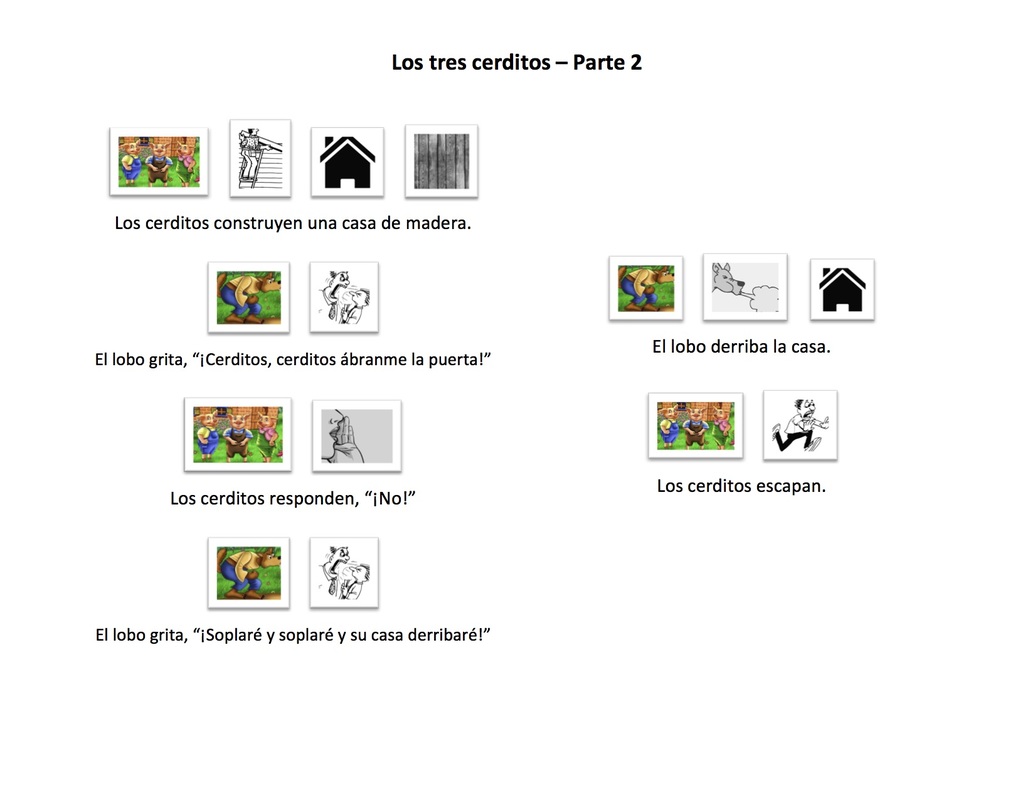
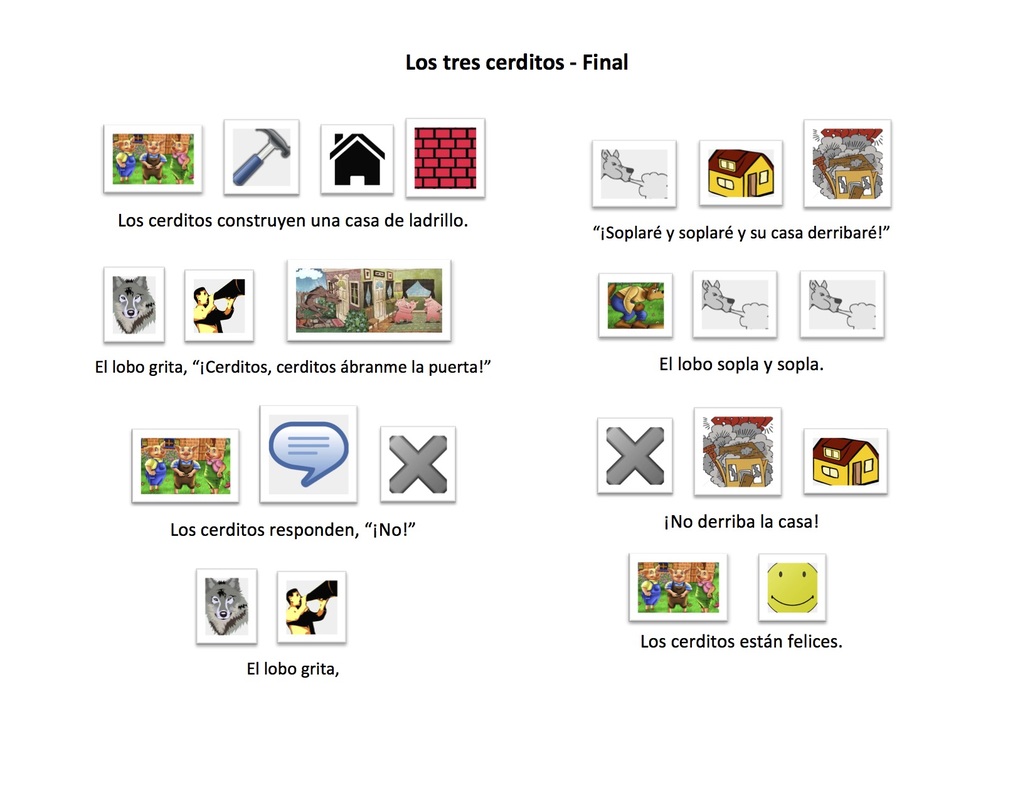
The story was divided into three sections pictured below: the straw house, wood house, and brick house. In a one-on-one reading assessment, I instructed students to start reading at the beginning of the text and to continue until I paused them to ask one or more questions. I then measured student pronunciation, demonstrated comprehension, and interpretative ability with a rubric.
The story was divided into three sections pictured below: the straw house, wood house, and brick house. In a one-on-one reading assessment, I instructed students to start reading at the beginning of the text and to continue until I paused them to ask one or more questions. I then measured student pronunciation, demonstrated comprehension, and interpretative ability with a rubric.
This assessment style connects to students’ work in their language arts classes, where they engage in the guided reading model developed by Jan Richardson in her book The Next Step in Guided Reading: Focused Assessments and Targeted Lessons for Helping Every Student Become a Better Reader. By connecting to students’ work in their language arts classes, I was able to build on an already-established instructional model with which students were familiar; this facilitated my goal of teaching 90% in Spanish. Students and I spent classroom time throughout the year working in small groups reading and analyzing texts in Spanish. In part two of this assessment, discussed in more detail in the section dedicated to qualitative data, I assessed students on their collaborative work. Students worked in small groups to prepare and present the entire fable in a storytelling format. Students used illustrations, dramatic retell strategies, and their knowledge of Spanish to engage in rigorous interpretive performances of the story.
|
Student individual reading was measured with a rubric that was divided into two rows: “Spoken Language” and “Interpretation.” (The third row of the rubric was reserved for student performance, not in a one-on-one assessment of student storytelling ability.) Students were rated on a one to four scale. Using the rubric, I first assessed students’ pronunciation. For each word pronounced incorrectly to the degree that would impede comprehension by a sympathetic native speaker of Spanish, I took off one point. (However, I did not take off more than one point for the same word if the word was mispronounced multiple times in the same assessment.) I used the rubric to also measure student understanding and interpretive ability. First, I assessed student comprehension through their gestures and fluctuations in tone of voice demonstrating their understanding of the text. Thereafter, I asked students an inference question relating to character emotions: “How does this character feel here? How do you know?” Using the rubric, I rated students’ interpretative ability. Each student earned an individual score that was the average of their scores on the two rows within the "Individual Rubric" pictured below.
In part two of this assessment, students were assessed on the organization of the group performance, as well as the preparedness and collaborative efforts. Students once again were rated on a scale of one to four. Student achievement on this rubric is based on my observational notes from student group work throughout the period of preparation leading up to the final performance assessment. This score is captured in the rows titled, "Collaboration" and "Participation." Then, student groups were rated on the day of their performance based upon the organization of their presentations using the row titled, "Organization." Each collaborative group earned a group score that was the average of their scores on the three rows within the "Group Rubric" pictured below. |
Pre and Post Assessments
In order to make this assessment a reliable demonstration of student growth, I used the same fable to assess student dramatic reading at the start and end of the year. However, at the start of the year I only assessed students’ ability to read and analyze in a guided-reading format; I did not assess student collaborative work on a performance of the text. I assessed students reading of the same fable without any instruction or preparation in order to gather data on their ability to decode words in Spanish with only the use of prior knowledge of the story and images above each word. Then, I scored students on the aforementioned rubric measuring their spoken language and interpretation of the text.
At the end of the year, I once again sat with each student and assessed their reading ability with the same rubric. However, I also assessed student performance in collaborative groups using a second rubric. More information on this, as well as sample student work, is provided in the qualitative portion of this section of my portfolio.
At the end of the year, I once again sat with each student and assessed their reading ability with the same rubric. However, I also assessed student performance in collaborative groups using a second rubric. More information on this, as well as sample student work, is provided in the qualitative portion of this section of my portfolio.
Data Analysis
The graphs below summarize the growth students experienced as a result of our work together in Spanish class. The data here are the class averages of student assessment results divided into beginning-of-year (BOY) results and end-of-year (EOY) results. Click on each graph below to see statistical data on student growth. Refer to the subheadings below each graph for more contextual information and explanation.
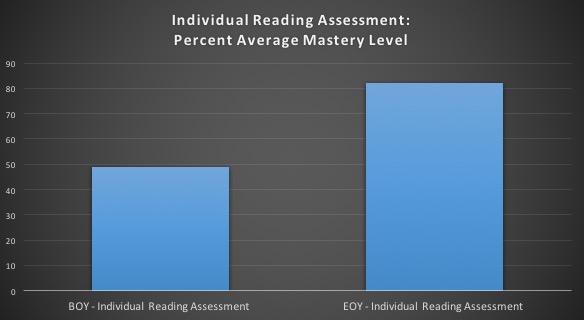
Individual Reading Assessment:
|
Disaggregated Data:
|
Collaborative Assessment:
|
|
The data in this graph represents the class average of individual student reading scores presented as students' percent mastery level. At the beginning of the year, the class average rubric score was 1.96/4.00 or an average of 49% mastery. At the end of the year, the class average rubric score was 3.28/4.00 or an average of 82%. This data demonstrates an overall average growth of 33% or 1.32 points on the rubrics. In sum, students in my class attained an average EOY mastery level of 82% on the individual assessment.
|
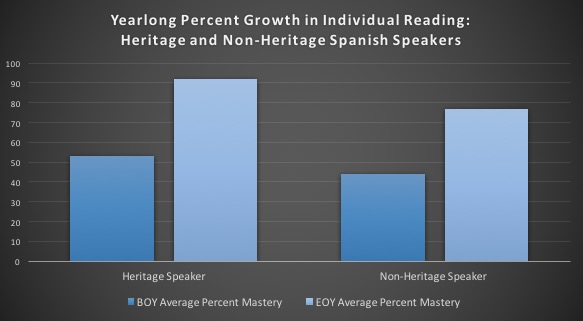
To create a multi-dimensional image of this data on student growth, I have disaggregated the results based on students' exposure to Spanish. In this graph, I separate student growth results into two categories: heritage speakers and non-heritage speakers of Spanish. Heritage speakers are those who have spoken Spanish at home or who may have learned Spanish as a first language; however, these students often lack basic literacy skills. I then compare the BOY and EOY data of those two subgroups of students. While heritage students grew from an average mastery level of 55% to an average of 92%, non-heritage speakers grew from 44% to 77%. These results indicate an overall higher average growth in the subcategory of heritage speakers of Spanish. Because roughly a third of my students are heritage speakers of Spanish, leaving two thirds of students as non-heritage speakers, this leaves the overall average mastery level at 82%.
|
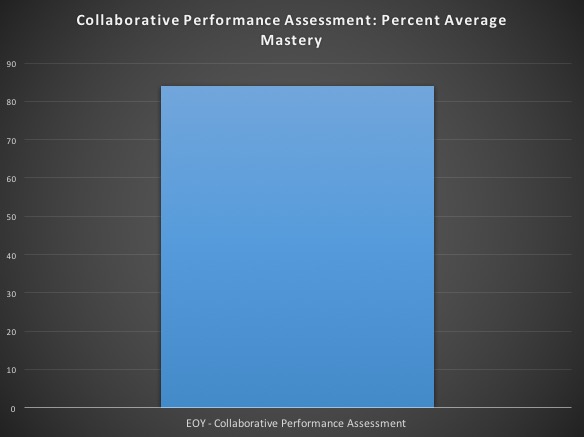
In this final graph, the results of student collaborative performance on the storytelling final assessment is represented as the EOY class average. Because of the nature of the work leading up to a collaborative performance, it was not feasible to obtain BOY data on student performance. However, student achievement was assessed using a collaborative rubric pictured below. On the collaborative performance assessment, students reached a class average mastery level of 84.2% on the rubric.
|